Case Study · Systems Diagramming
Deconstructing Flowline Canvas
How a calm, constrained canvas helps people turn what's in their head into a diagram others can follow.
The Insight
Most people can explain a system out loud but freeze in front of a blank canvas with a hundred tools. The goal was fewer shapes and clearer connections.
The Interface (Annotated)
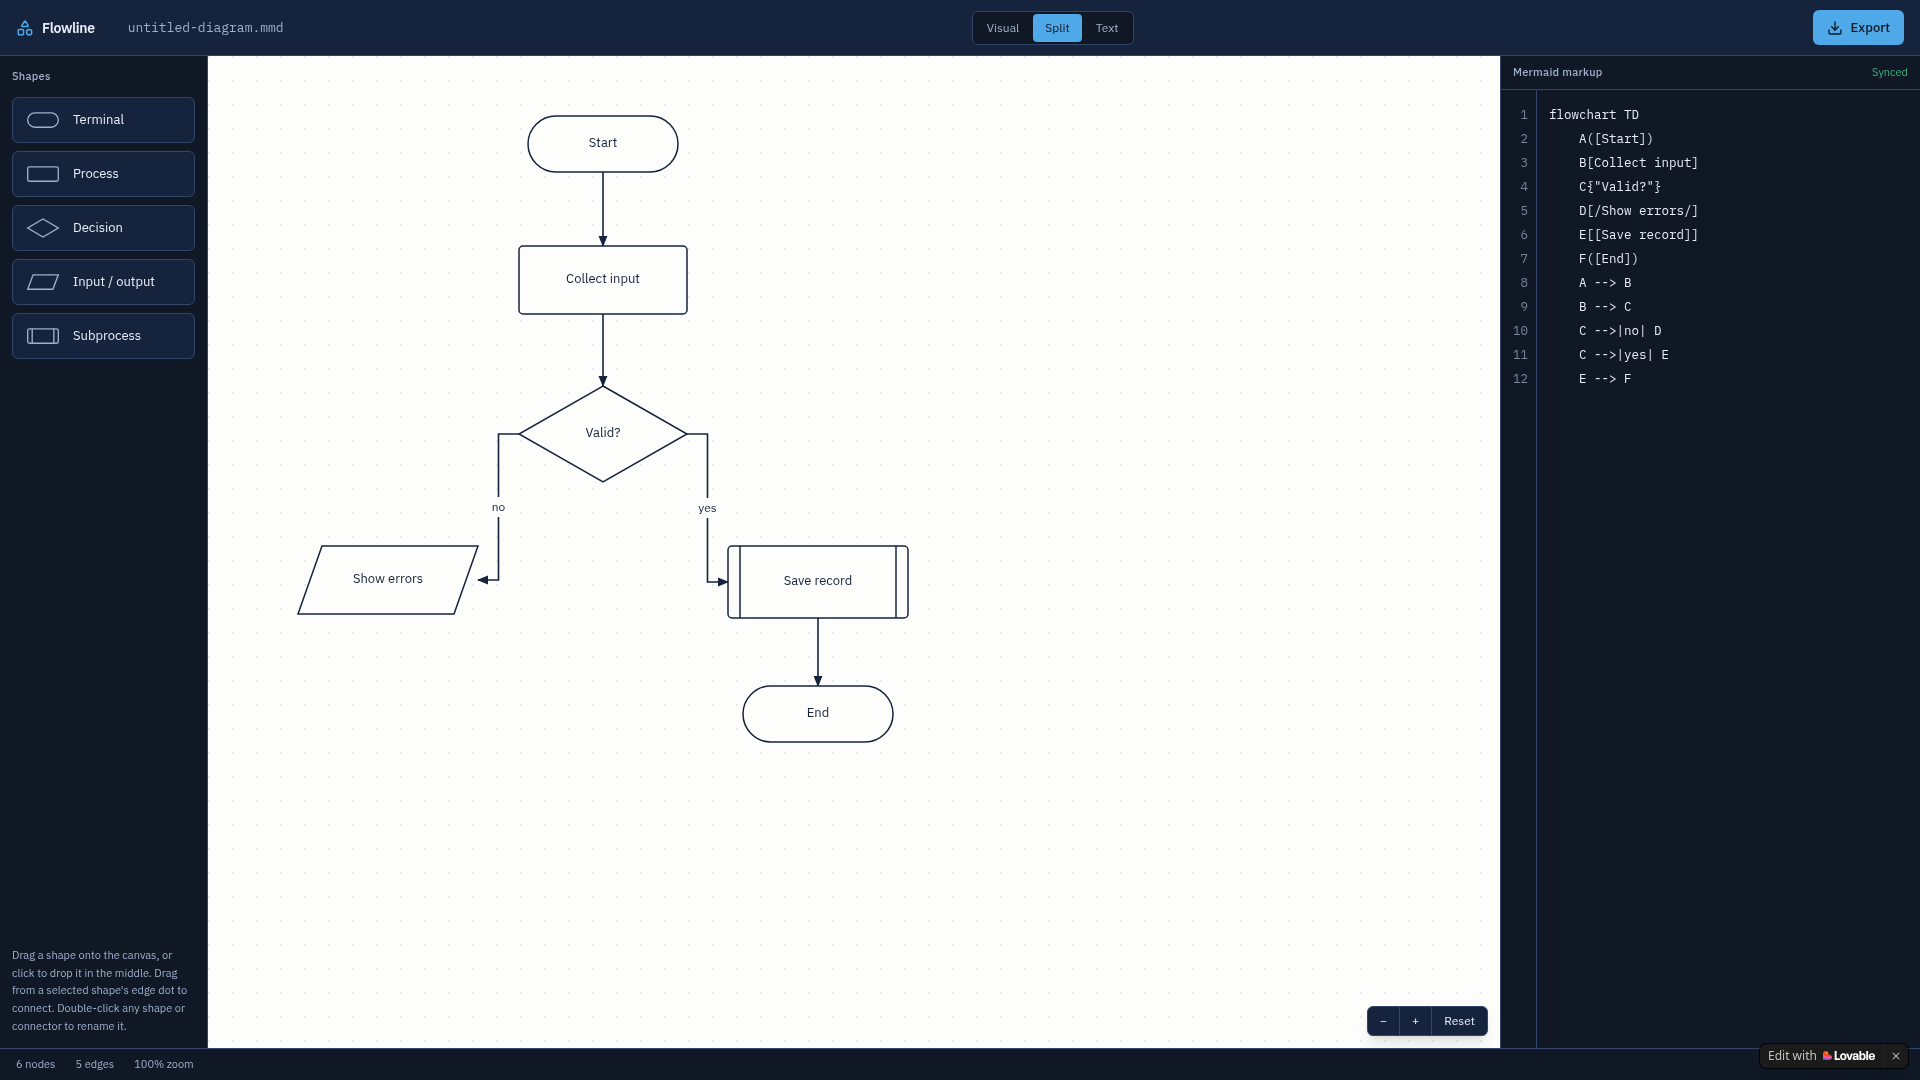
Tap a pin to see what it does.
- 1
One Core Node
Every diagram starts from a single idea in the middle
- 2
Relationship Lines
Lines carry the meaning; shapes stay simple
- 3
Limited Shape Set
Two shapes only, so the thinking stays on the logic
Product Decisions & Tradeoffs
What shipped
Nodes, connectors and a dot grid
Deliberately cut
Templates, colors per node, real-time collaboration
ChoiceDiamonds for ideas, lines for relationships.
Trade-offPower users want more. Beginners finish their first diagram.
ChoiceInk and one accent.
Trade-offLess personal, much easier to read.
Diagrams started
[VERIFY: count]
Diagrams finished
[VERIFY: count]
The AI Build Story
[VERIFY]
Prompting iterations
Built with AI as a non-technical PM, to get connectors that follow nodes when you drag them.
- 01Dragging a node used to leave its lines behind. I described it like a kite string and the fix finally landed.
Try This
Try it: explain a process you know to a friend, then draw only the arrows you said out loud.
Next exhibit · 01
STEM Discovery Lab →